

Pola sebenarnya

Bullish Symmetrical Triangle
was formed on 18.03 at 20:46:23 (UTC+0)
signal strength 1 of 5
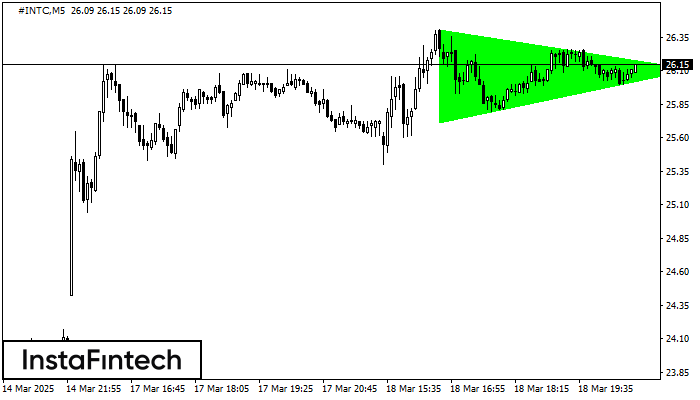
According to the chart of M5, #INTC formed the Bullish Symmetrical Triangle pattern. The lower border of the pattern touches the coordinates 25.72/26.11 whereas the upper border goes across 26.41/26.11. If the Bullish Symmetrical Triangle pattern is in progress, this evidently signals a further upward trend. In other words, in case the scenario comes true, the price of #INTC will breach the upper border to head for 26.26.
The M5 and M15 time frames may have more false entry points.
- All
- All
- Bearish Rectangle
- Bearish Symmetrical Triangle
- Bearish Symmetrical Triangle
- Bullish Rectangle
- Double Top
- Double Top
- Triple Bottom
- Triple Bottom
- Triple Top
- Triple Top
- All
- All
- Buy
- Sale
- All
- 1
- 2
- 3
- 4
- 5
Bawah Ganda
was formed on 21.03 at 03:20:20 (UTC+0)
signal strength 1 of 5
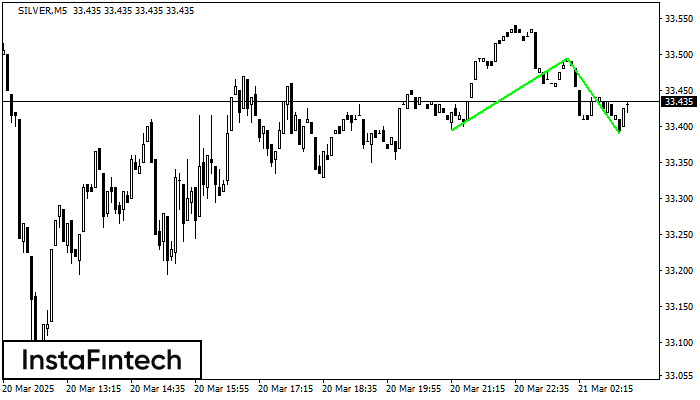
Pola Bawah Ganda telah terbentuk pada SILVER M5. Karakteristik: level support 33.40; level resistance 33.49; lebar pola 100 poin. Jika level resistance ditembus, perubahan dalam tren dapat diprediksi dengan target
Rangka waktu M5 dan M15 mungkin memiliki lebih dari titik entri yang keliru.
Open chart in a new window
Bawah Ganda
was formed on 21.03 at 03:15:41 (UTC+0)
signal strength 2 of 5
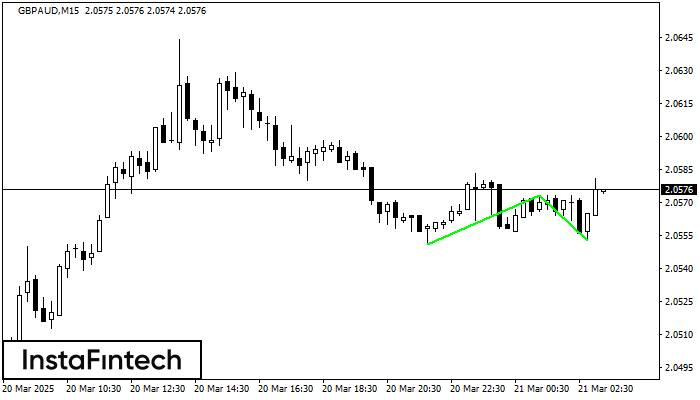
Pola Bawah Ganda telah terbentuk pada GBPAUD M15; batas atas di 2.0573; batas bawah di 2.0553. Lebar pola sebesar 22 poin. Jika harga menembus batas atas 2.0573, Perubahan dalam tren
Rangka waktu M5 dan M15 mungkin memiliki lebih dari titik entri yang keliru.
Open chart in a new window
Bawah Ganda
was formed on 21.03 at 03:15:20 (UTC+0)
signal strength 1 of 5
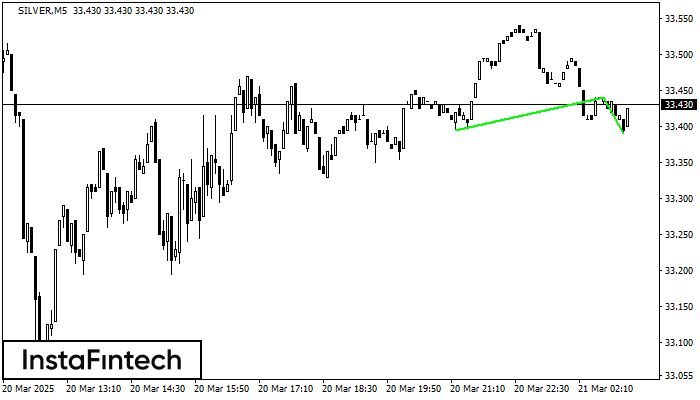
Pola Bawah Ganda telah terbentuk pada SILVER M5. Formasi ini mensinyalkan reversal tren dari arah penurunan ke arah kenaikan. Sinyal menunjukkan bahwa transaksi beli harus dibuka setelah batas atas pola
Rangka waktu M5 dan M15 mungkin memiliki lebih dari titik entri yang keliru.
Open chart in a new window


