

Pola sebenarnya

Bullish Symmetrical Triangle
was formed on 18.03 at 00:00:11 (UTC+0)
signal strength 2 of 5
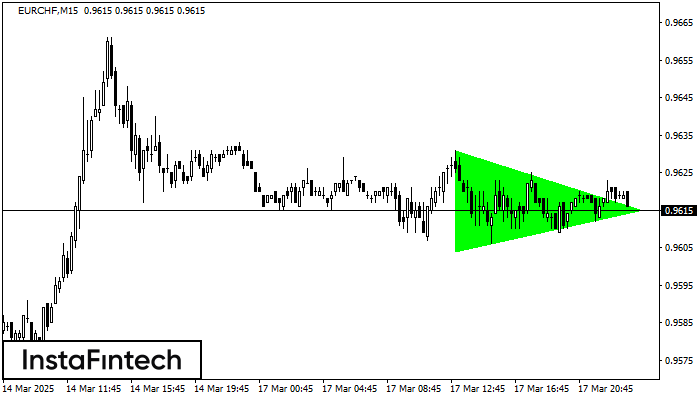
According to the chart of M15, EURCHF formed the Bullish Symmetrical Triangle pattern. Description: This is the pattern of a trend continuation. 0.9631 and 0.9604 are the coordinates of the upper and lower borders respectively. The pattern width is measured on the chart at 27 pips. Outlook: If the upper border 0.9631 is broken, the price is likely to continue its move by 0.9638.
The M5 and M15 time frames may have more false entry points.
- All
- All
- Bearish Rectangle
- Bearish Symmetrical Triangle
- Bearish Symmetrical Triangle
- Bullish Rectangle
- Double Top
- Double Top
- Triple Bottom
- Triple Bottom
- Triple Top
- Triple Top
- All
- All
- Buy
- Sale
- All
- 1
- 2
- 3
- 4
- 5
Bawah Triple
was formed on 21.03 at 01:00:34 (UTC+0)
signal strength 2 of 5
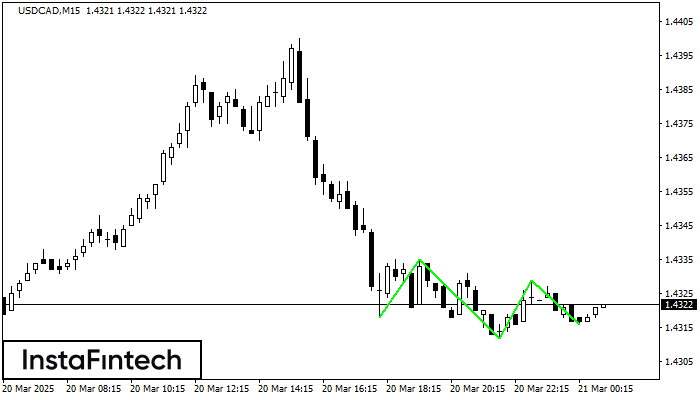
Pola Bawah Triple telah terbentuk pada USDCAD M15. Pola tersebut memiliki karakteristik sebagai berikut: level resistance 1.4335/1.4329; level support 1.4318/1.4316; dengan lebar 17 poin. Jika terjadi pemecahan (breakdown) pada level
Rangka waktu M5 dan M15 mungkin memiliki lebih dari titik entri yang keliru.
Open chart in a new window
Persegi Bullish
was formed on 21.03 at 00:40:12 (UTC+0)
signal strength 2 of 5
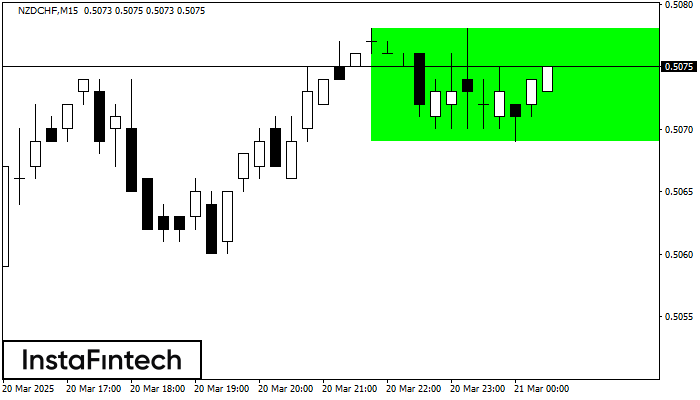
Menurut grafik dari M15, NZDCHF terbentuk Persegi Bullish. Pola menunjukkan kelanjutan tren. Batas atas adalah 0.5078, batas lebih rendah adalah 0.5069. Sinyal berarti posisi beli harus dibuka diatas batas atas
Rangka waktu M5 dan M15 mungkin memiliki lebih dari titik entri yang keliru.
Open chart in a new window
Persegi Bullish
was formed on 21.03 at 00:21:22 (UTC+0)
signal strength 1 of 5
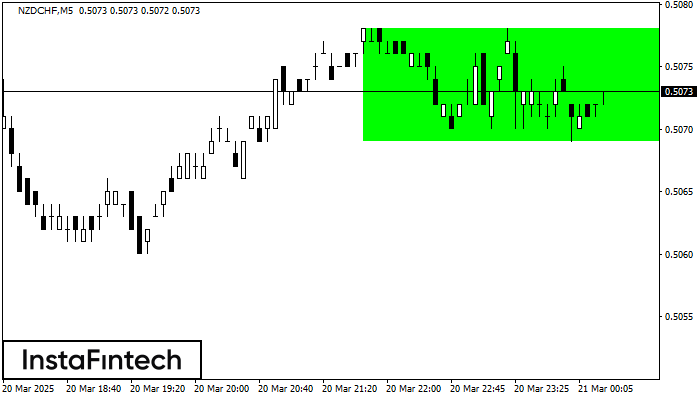
Menurut grafik dari M5, NZDCHF terbentuk Persegi Bullish. Jenis pola ini menunjukkan kelanjutan tren. Terdiri dari dua tingkat: resistance 0.5078 dan support 0.5069. Jika level resistance 0.5078 - 0.5078 ditembus
Rangka waktu M5 dan M15 mungkin memiliki lebih dari titik entri yang keliru.
Open chart in a new window


