

Pola sebenarnya

Double Bottom
was formed on 17.03 at 18:20:30 (UTC+0)
signal strength 1 of 5
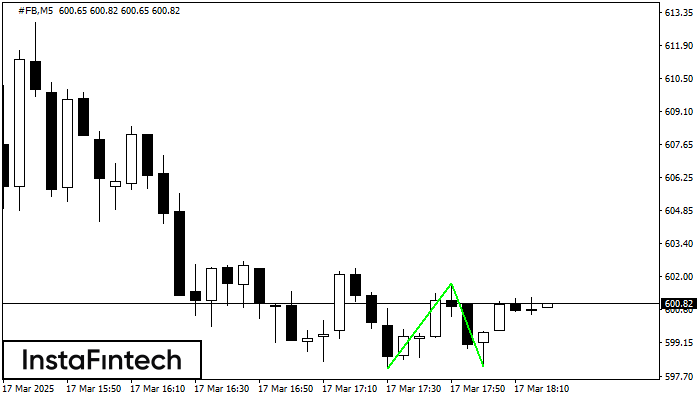
The Double Bottom pattern has been formed on #FB M5. This formation signals a reversal of the trend from downwards to upwards. The signal is that a buy trade should be opened after the upper boundary of the pattern 601.69 is broken. The further movements will rely on the width of the current pattern 366 points.
The M5 and M15 time frames may have more false entry points.
Lihat juga
- All
- All
- Bearish Rectangle
- Bearish Symmetrical Triangle
- Bearish Symmetrical Triangle
- Bullish Rectangle
- Double Top
- Double Top
- Triple Bottom
- Triple Bottom
- Triple Top
- Triple Top
- All
- All
- Buy
- Sale
- All
- 1
- 2
- 3
- 4
- 5
Bearish Symmetrical Triangle
was formed on 18.03 at 08:42:54 (UTC+0)
signal strength 1 of 5
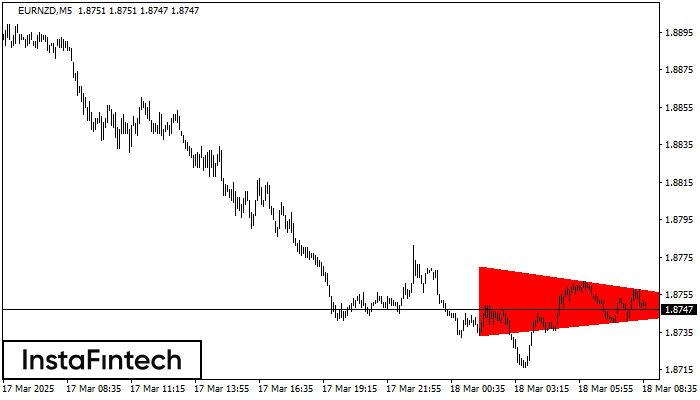
According to the chart of M5, EURNZD formed the Bearish Symmetrical Triangle pattern. Description: The lower border is 1.8733/1.8748 and upper border is 1.8770/1.8748. The pattern width is measured
The M5 and M15 time frames may have more false entry points.
Open chart in a new window
Head and Shoulders
was formed on 18.03 at 08:30:10 (UTC+0)
signal strength 3 of 5
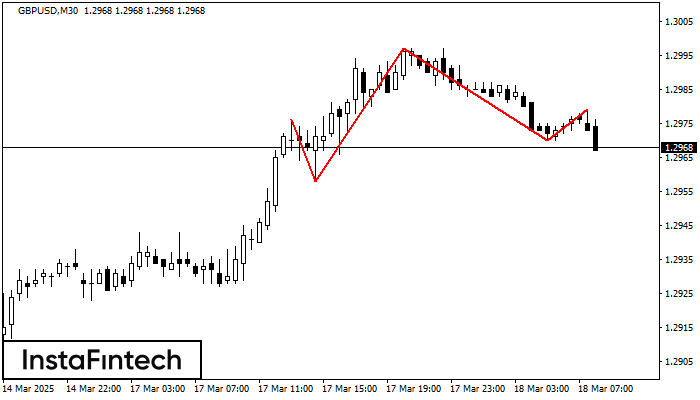
The technical pattern called Head and Shoulders has appeared on the chart of GBPUSD M30. There are weighty reasons to suggest that the price will surpass the Neckline 1.2958/1.2970 after
Open chart in a new window
Triple Top
was formed on 18.03 at 08:01:01 (UTC+0)
signal strength 1 of 5
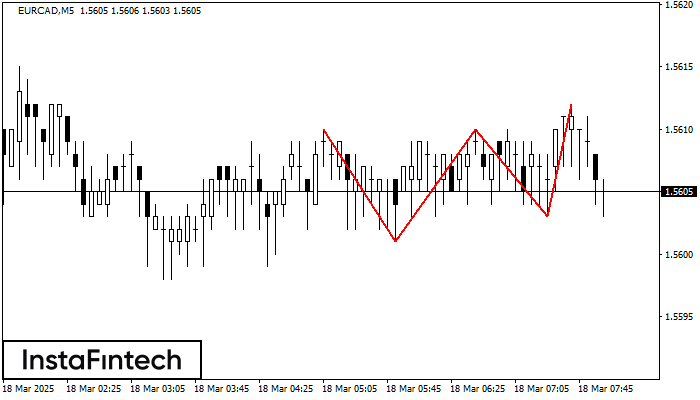
The Triple Top pattern has formed on the chart of the EURCAD M5. Features of the pattern: borders have an ascending angle; the lower line of the pattern
The M5 and M15 time frames may have more false entry points.
Open chart in a new window


