

Pola sebenarnya

Bullish Rectangle
was formed on 17.03 at 07:50:04 (UTC+0)
signal strength 1 of 5
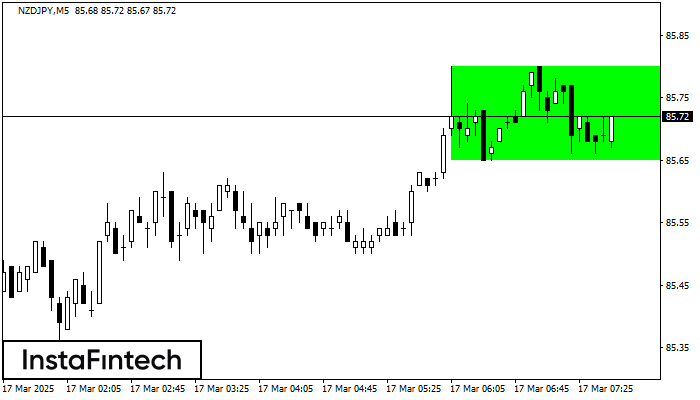
According to the chart of M5, NZDJPY formed the Bullish Rectangle. The pattern indicates a trend continuation. The upper border is 85.80, the lower border is 85.65. The signal means that a long position should be opened above the upper border 85.80 of the Bullish Rectangle.
The M5 and M15 time frames may have more false entry points.
Lihat juga
- All
- All
- Bearish Rectangle
- Bearish Symmetrical Triangle
- Bearish Symmetrical Triangle
- Bullish Rectangle
- Double Top
- Double Top
- Triple Bottom
- Triple Bottom
- Triple Top
- Triple Top
- All
- All
- Buy
- Sale
- All
- 1
- 2
- 3
- 4
- 5
Bullish Rectangle
was formed on 18.03 at 03:13:05 (UTC+0)
signal strength 3 of 5
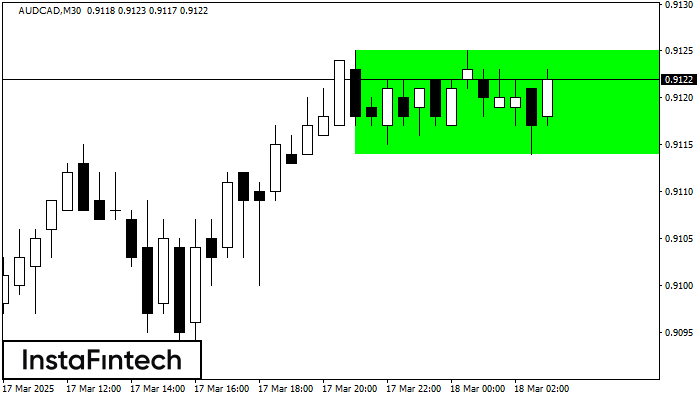
According to the chart of M30, AUDCAD formed the Bullish Rectangle which is a pattern of a trend continuation. The pattern is contained within the following borders: the lower border
Open chart in a new window
Bullish Rectangle
was formed on 18.03 at 03:05:12 (UTC+0)
signal strength 2 of 5
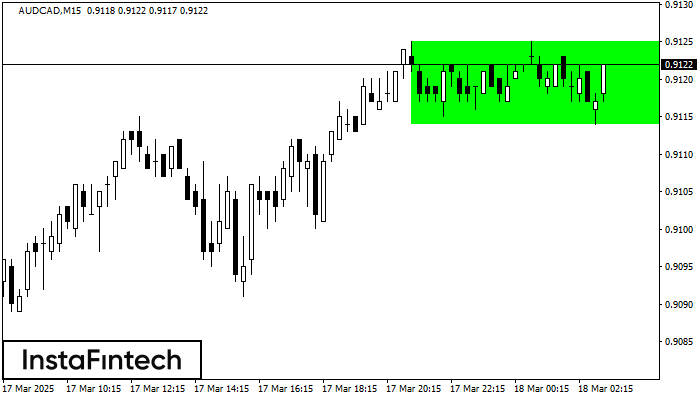
According to the chart of M15, AUDCAD formed the Bullish Rectangle which is a pattern of a trend continuation. The pattern is contained within the following borders: the lower border
The M5 and M15 time frames may have more false entry points.
Open chart in a new window
Bullish Symmetrical Triangle
was formed on 18.03 at 03:00:24 (UTC+0)
signal strength 2 of 5
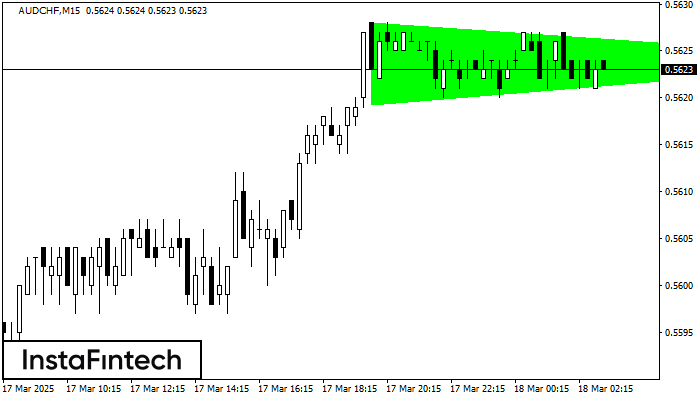
According to the chart of M15, AUDCHF formed the Bullish Symmetrical Triangle pattern. Description: This is the pattern of a trend continuation. 0.5628 and 0.5619 are the coordinates
The M5 and M15 time frames may have more false entry points.
Open chart in a new window


