

Pola sebenarnya

Head and Shoulders
was formed on 12.03 at 11:00:11 (UTC+0)
signal strength 3 of 5
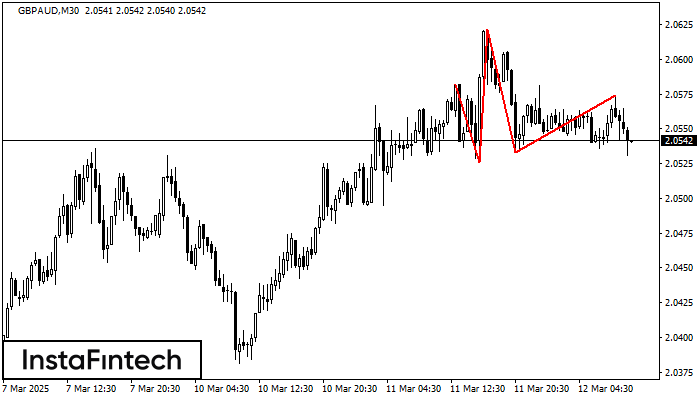
According to the chart of M30, GBPAUD formed the Head and Shoulders pattern. The Head’s top is set at 2.0622 while the median line of the Neck is found at 2.0526/2.0533. The formation of the Head and Shoulders pattern evidently signals a reversal of the upward trend. In other words, in case the scenario comes true, the price of GBPAUD will go towards 2.0503.
- All
- All
- Bearish Rectangle
- Bearish Symmetrical Triangle
- Bearish Symmetrical Triangle
- Bullish Rectangle
- Double Top
- Double Top
- Triple Bottom
- Triple Bottom
- Triple Top
- Triple Top
- All
- All
- Buy
- Sale
- All
- 1
- 2
- 3
- 4
- 5
Triple Top
was formed on 18.03 at 22:35:18 (UTC+0)
signal strength 1 of 5
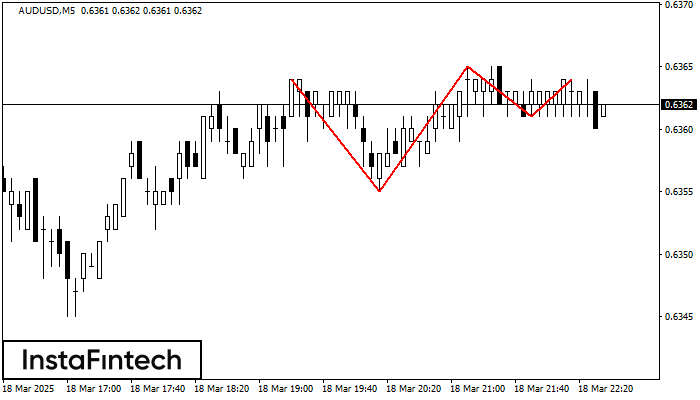
The Triple Top pattern has formed on the chart of the AUDUSD M5 trading instrument. It is a reversal pattern featuring the following characteristics: resistance level 0, support level -6
The M5 and M15 time frames may have more false entry points.
Open chart in a new window
Triple Top
was formed on 18.03 at 22:30:19 (UTC+0)
signal strength 1 of 5
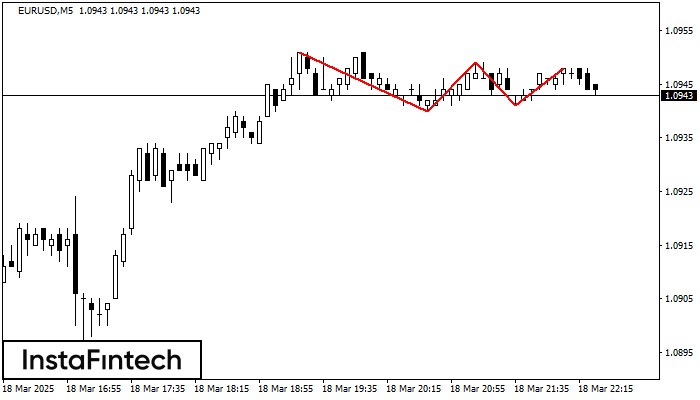
The Triple Top pattern has formed on the chart of the EURUSD M5. Features of the pattern: borders have an ascending angle; the lower line of the pattern
The M5 and M15 time frames may have more false entry points.
Open chart in a new window
Bullish Symmetrical Triangle
was formed on 18.03 at 22:03:18 (UTC+0)
signal strength 1 of 5
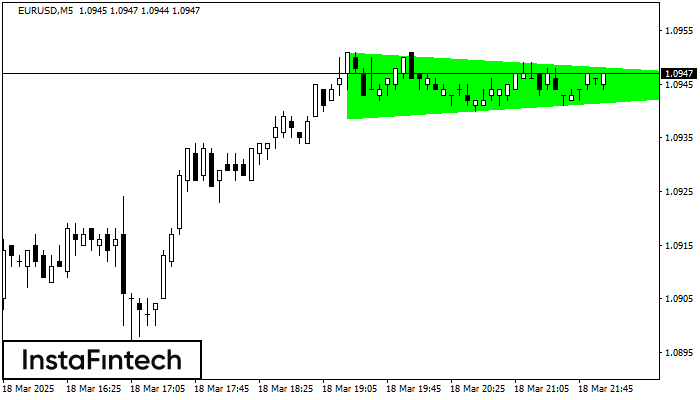
According to the chart of M5, EURUSD formed the Bullish Symmetrical Triangle pattern. Description: This is the pattern of a trend continuation. 1.0951 and 1.0939 are the coordinates
The M5 and M15 time frames may have more false entry points.
Open chart in a new window


