empty

Figures of technical analysis

Pennant

Technical analysis: Pennant

The Pennant pattern is a well-known pattern that is widely used in technical analysis. This figure is regularly found on trading charts of almost all currency pairs.
The development of Pennant on the trading chart indicate continuation of the trend.

Head and shoulders

Technical analysis: Head and shoulders

The "Head and Shoulders" pattern is primarily a reversal pattern. This pattern is formed on the basis of 3 tops or 3 bottoms, moreover the middle top(bottom) higher than the other two.

Double Top

Technical analysis: Double Top

The Double Top pattern is an easily recognizable reversal pattern. This pattern is usually formed near the resistance level and signals a situation on the market when the price fails to break the resistance line two times in a row.

Rectangle

Technical analysis: Rectangle

Rectangle - one of the most famous and simple methods of technical analysis in trade. Although it is easy to determine on the charts, this is an important and very strong figure, which is an indicator of the continuation of the trend. Due to the correct recognition of the rectangle, the trader can successfully enter the market.

Triangle

Technical analysis: Triangle

Triangles are among the most popular chart patterns used in technical analysis. This candlestick combination can be found on most financial instruments and on any time frame. Triangles fall under the category of continuation patterns, meaning that it is preceded by the trend, either bullish or bearish one.

Flag

Technical analysis: Flag

The flag is a model predicting the continuation of the trend. As well as other similar figures of trend continuation, it is formed after a rapid price movement and is similar to a slowdown. When the flat is completed, followed by a continuation of the trend, usually the same strong as the trend before.

Triple Top

Technical analysis: Triple Top

Triple top is reversal pattern consisting of three equal highs followed by a break below the support level.

Actual patterns

Bullish pennant
was formed on 14.03 at 18:03:43 (UTC+0)
signal strength 3 of 5

Bullish pennant NZDCHF M30

The Bullish pennant graphic pattern has formed on the NZDCHF M30 instrument. This pattern type falls under the category of continuation patterns. In this case, if the quote can breaks

Open chart in a new window

Bullish pennant
was formed on 14.03 at 16:59:38 (UTC+0)
signal strength 3 of 5

Bullish pennant AUDCHF M30

The Bullish pennant pattern is formed on the AUDCHF M30 chart. It is a type of the continuation pattern. Supposedly, in case the price is fixed above the pennant’s high

Open chart in a new window

Triple Top
was formed on 14.03 at 07:30:02 (UTC+0)
signal strength 3 of 5

Triple Top SILVER M30

The Triple Top pattern has formed on the chart of the SILVER M30. Features of the pattern: borders have an ascending angle; the lower line of the pattern

Open chart in a new window
Can't speak right now?
Ask your question in the chat.
 

Dear visitor,

Your IP address shows that you are currently located in the USA. If you are a resident of the United States, you are prohibited from using the services of InstaFintech Group including online trading, online transfers, deposit/withdrawal of funds, etc.

If you think you are seeing this message by mistake and your location is not the US, kindly proceed to the website. Otherwise, you must leave the website in order to comply with government restrictions.

Why does your IP address show your location as the USA?

  • - you are using a VPN provided by a hosting company based in the United States;
  • - your IP does not have proper WHOIS records;
  • - an error occurred in the WHOIS geolocation database.

Please confirm whether you are a US resident or not by clicking the relevant button below. If you choose the wrong option, being a US resident, you will not be able to open an account with InstaTrade anyway.

We are sorry for any inconvenience caused by this message.
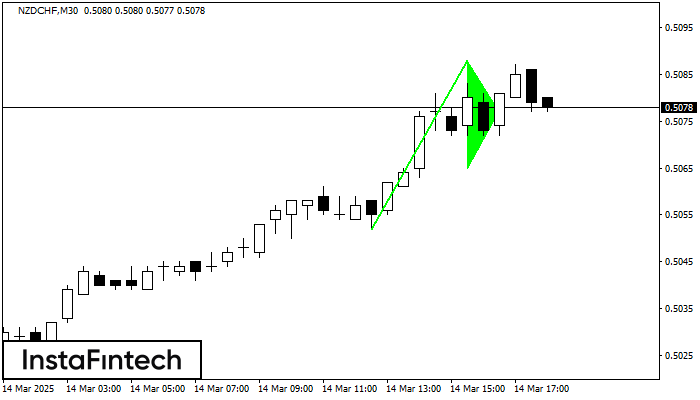