

Actual patterns

Patterns are graphical models which are formed in the chart by the price. According to one of the technical analysis postulates, history (price movement) repeats itself. It means that the price movements are often similar in the same situations which makes it possible to predict the further development of the situation with a high probability.
Relevant patterns by InstaTrade is an easy-to-use service which allows you to be aware of latest changes in the market and react to clues from the market in time. In our service you will always find the latest and most relevant patterns on any pair and any timeframe.
Triple Top
was formed on 20.03 at 22:55:12 (UTC+0)
signal strength 1 of 5
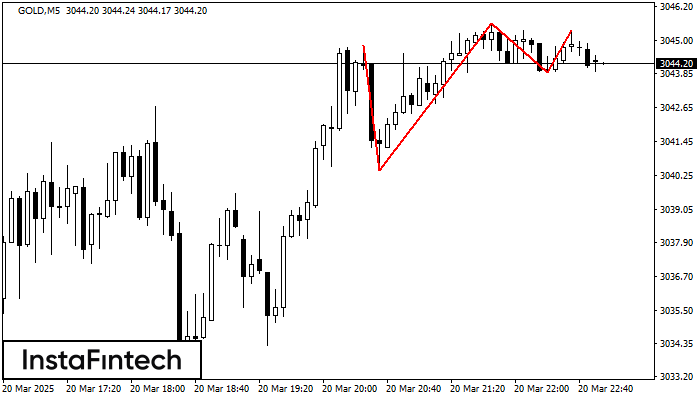
The Triple Top pattern has formed on the chart of the GOLD M5 trading instrument. It is a reversal pattern featuring the following characteristics: resistance level -50, support level -345, and pattern’s width 441. Forecast If the price breaks through the support level 3040.44, it is likely to move further down to 3045.46.
The M5 and M15 time frames may have more false entry points.
See Also
- All
- All
- Bearish Rectangle
- Bearish Symmetrical Triangle
- Bearish Symmetrical Triangle
- Bullish Rectangle
- Double Top
- Double Top
- Triple Bottom
- Triple Bottom
- Triple Top
- Triple Top
- All
- All
- Buy
- Sale
- All
- 1
- 2
- 3
- 4
- 5
डबल बॉटम
was formed on 25.03 at 00:00:26 (UTC+0)
signal strength 5 of 5
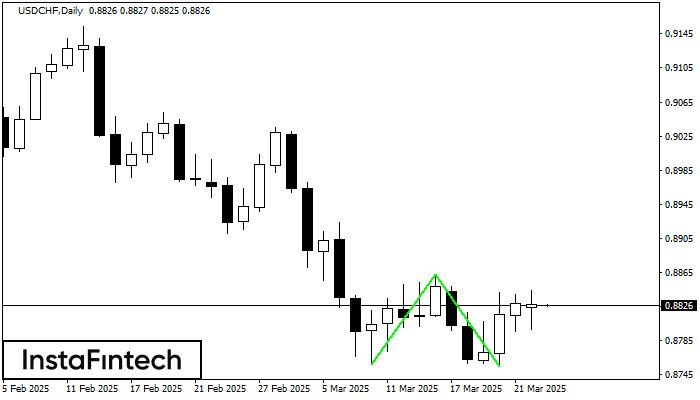
डबल बॉटम पैटर्न USDCHF D1 पर बना है। विशेषताएं: समर्थन स्तर 0.8757; प्रतिरोध स्तर 0.8863; पैटर्न की चौड़ाई 106 पॉइंट्स। यदि प्रतिरोध स्तर टूट जाता है, तो रुझान में बदलाव
Open chart in a new window
ट्रिपल टॉप
was formed on 24.03 at 23:01:00 (UTC+0)
signal strength 1 of 5

EURJPY M5 के चार्ट पर ट्रिपल टॉप पैटर्न बना है। पैटर्न की विशेषताएं: सीमाओं में एक आरोही कोण मौजूद है; पैटर्न की निचली रेखा 162.59/162.72 पर है और ऊपरी सीमा
M5 और M15 समय सीमा में अधिक फाल्स एंट्री पॉइंट्स हो सकते हैं।
Open chart in a new window
बुलिश फ्लैग
was formed on 24.03 at 23:00:23 (UTC+0)
signal strength 2 of 5

बुलिश फ्लैग पैटर्न NZDJPY M15 चार्ट पर बनाया गया है जो दर्शाता है कि ऊपर की ओर रुझान जारी रहेगा। संकेत: 86.28 पर शिखर के टूटने से कीमत अधिक हो
M5 और M15 समय सीमा में अधिक फाल्स एंट्री पॉइंट्स हो सकते हैं।
Open chart in a new window


