See also


The flag is a model predicting the continuation of the trend. As well as other similar figures of trend continuation, it is formed after a rapid price movement and is similar to a slowdown. When the flat is completed, followed by a continuation of the trend, usually the same strong as the trend before.
The flag chart pattern is one of the major chart patterns. It is a continuation signal that indicates further direction of a trend. Newcomers and professionals have different views about this pattern. While for beginners it means an upcoming flat market, market buffs view it as a trend pausing followed by continuation with equal force. Meanwhile, the price direction does not matter. The flag forms both during an uptrend and a downtrend.
Basic criteria of formation:
It is worth noting that this algorithm is applicable for all chart patterns. And despite the fact that some traders are concerned about the loss of a significant part of the estimated profit, this approach is fully justified.
Given that the market is unpredictable, even the most reliable patterns do not always work. So we recommend that you use it exactly in the same way. First 30% of the lost profit will eliminate the risk of false breakouts, while the other 30% will hedge against incomplete workout.
Alternatively, if, after reaching 70% of the expected profit, there will be 2-3 clear signals about the further price direction, you can always leave the trade open.
In conclusion, pay attention to the fact that a sharp rise before the formation of the flag pattern can take place after some important news. And this means the lower probability of the workout. Therefore, trading the flag pattern, carefully explain the reasons why it was formed.
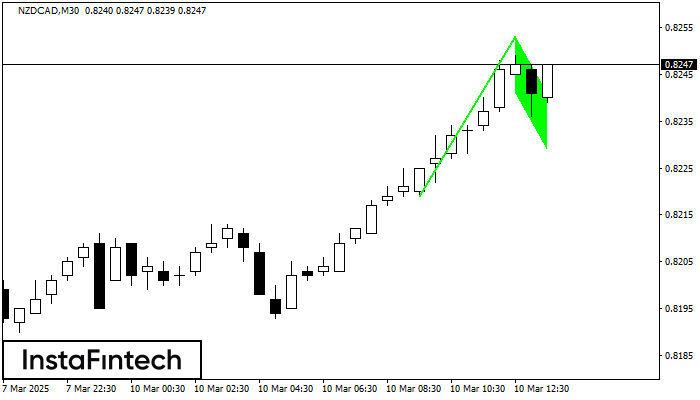
The Bullish Flag pattern has been formed on the chart NZDCAD M30 which signals that the upward trend will continue. Signals: а break of the peak at 0.8253 may push
Open chart in a new window
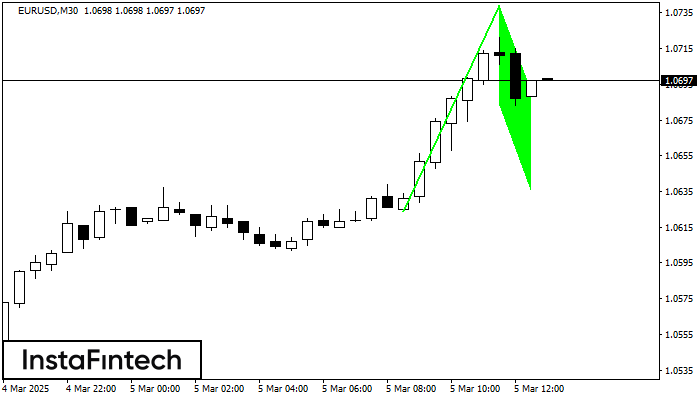
The Bullish Flag pattern has been formed on EURUSD at M30. The lower boundary of the pattern is located at 1.0683/1.0635, while the higher boundary lies at 1.0739/1.0691. The projection
Open chart in a new window
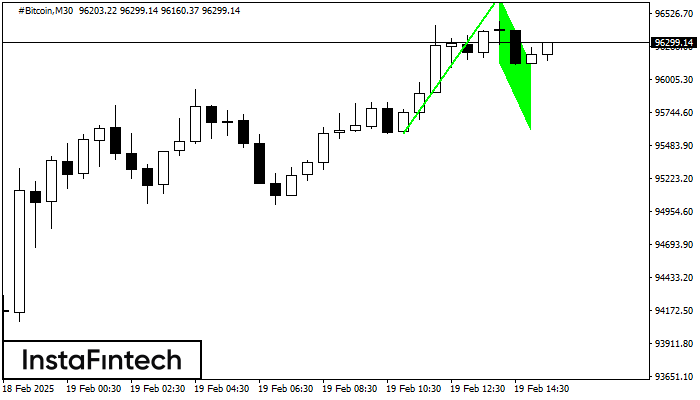
The Bullish Flag pattern has been formed on #Bitcoin at M30. The lower boundary of the pattern is located at 96134.47/95596.99, while the higher boundary lies at 96666.01/96128.53. The projection
Open chart in a new window


Your IP address shows that you are currently located in the USA. If you are a resident of the United States, you are prohibited from using the services of InstaFintech Group including online trading, online transfers, deposit/withdrawal of funds, etc.
If you think you are seeing this message by mistake and your location is not the US, kindly proceed to the website. Otherwise, you must leave the website in order to comply with government restrictions.
Why does your IP address show your location as the USA?
Please confirm whether you are a US resident or not by clicking the relevant button below. If you choose the wrong option, being a US resident, you will not be able to open an account with InstaTrade anyway.
We are sorry for any inconvenience caused by this message.