

Actual patterns

Patterns are graphical models which are formed in the chart by the price. According to one of the technical analysis postulates, history (price movement) repeats itself. It means that the price movements are often similar in the same situations which makes it possible to predict the further development of the situation with a high probability.
Relevant patterns by InstaTrade is an easy-to-use service which allows you to be aware of latest changes in the market and react to clues from the market in time. In our service you will always find the latest and most relevant patterns on any pair and any timeframe.
Double Bottom
was formed on 20.03 at 19:15:16 (UTC+0)
signal strength 2 of 5
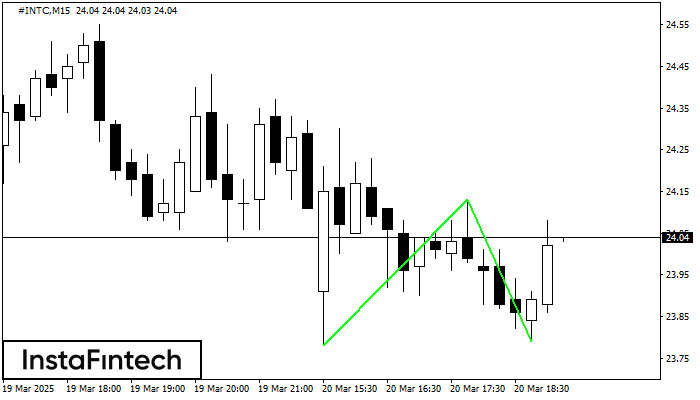
The Double Bottom pattern has been formed on #INTC M15. This formation signals a reversal of the trend from downwards to upwards. The signal is that a buy trade should be opened after the upper boundary of the pattern 24.13 is broken. The further movements will rely on the width of the current pattern 35 points.
The M5 and M15 time frames may have more false entry points.
See Also
- All
- All
- Bearish Rectangle
- Bearish Symmetrical Triangle
- Bearish Symmetrical Triangle
- Bullish Rectangle
- Double Top
- Double Top
- Triple Bottom
- Triple Bottom
- Triple Top
- Triple Top
- All
- All
- Buy
- Sale
- All
- 1
- 2
- 3
- 4
- 5
Teratas Ganda
was formed on 25.03 at 10:35:55 (UTC+0)
signal strength 1 of 5
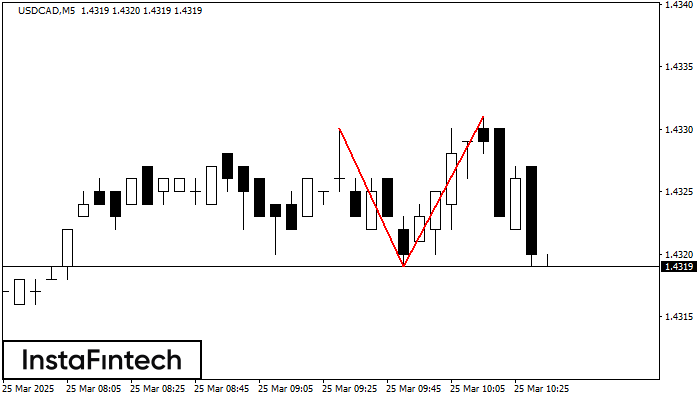
Pada grafik USDCAD M5 pola reversal Teratas Ganda telah terbentuk. Karakteristik: batas atas 1.4331; batas bawah 1.4319; lebar pola 12 poin. Sinyal: tembusan ke batas bawah akan menyebabkan kelanjutan tren
Rangka waktu M5 dan M15 mungkin memiliki lebih dari titik entri yang keliru.
Open chart in a new window
Segitiga Simetris Bearish
was formed on 25.03 at 09:01:43 (UTC+0)
signal strength 2 of 5

Menurut Grafik dari M15, NZDCAD dibentuk pola Segitiga Simetris Bearish. Pola ini mengisyaratkan tren penurunan lebih lanjut jika terdapat batas yang lebih rendah 0.8172 ditembus. Disini, sebuah keuntungan hipotetis akan
Rangka waktu M5 dan M15 mungkin memiliki lebih dari titik entri yang keliru.
Open chart in a new window
Segitiga Simetris Bullish
was formed on 25.03 at 07:05:25 (UTC+0)
signal strength 1 of 5

Menurut Grafik dari M5, AUDUSD dibentuk pola Segitiga Simetris Bullish, yang menunjukkan tren akan berlanjut. Deksripsi. Batas atas dari pola menyentuh kordinat 0.6295/0.6288 dimana batas yang lebih rendah berada sepanjang
Rangka waktu M5 dan M15 mungkin memiliki lebih dari titik entri yang keliru.
Open chart in a new window


