

অ্যাকচুয়াল প্যাটার্নস

প্যাটার্ন হলো গ্রাফিক্যাল মডেল, যা মূল্য ওঠানামার ভিত্তিতে চার্টে তৈরি হয়। টেকনিক্যাল বিশ্লেষণের নীতি অনুযায়ী, ইতিহাসের (প্রাইস মুভমেন্ট) পুনরাবৃত্তি ঘটে। অর্থাৎ, পরিস্থিতি যদি একই রকম থাকে তাহলে প্রাইস মুভমেন্টও প্রায় একই রকম হয়। এর ফলে মূল্যের ওঠানামা কেমন হবে তা আগেই থেকেই অনুমান করা যায়।
ইন্সটাফরেক্স এর প্রাসঙ্গিক প্যাটার্নসমূহ সহজেই ব্যবহার করা যায়, যার মাধ্যমে মার্কেটের সর্বশেষ পরিস্থিতি জানা যায় এবং তার উপর ভিত্তি করে সিদ্ধান্ত নেওয়া যায়। আমাদের সেবাগুলো থেকে আপনি যেকোনো পেয়ার এবং টাইমফ্রেমের জন্য সর্বশেষ এবং সবচেয়ে প্রাসঙ্গিক প্যাটার্নগুলো খুঁজে পাবেন।
Double Top
was formed on 04.04 at 21:55:03 (UTC+0)
signal strength 1 of 5
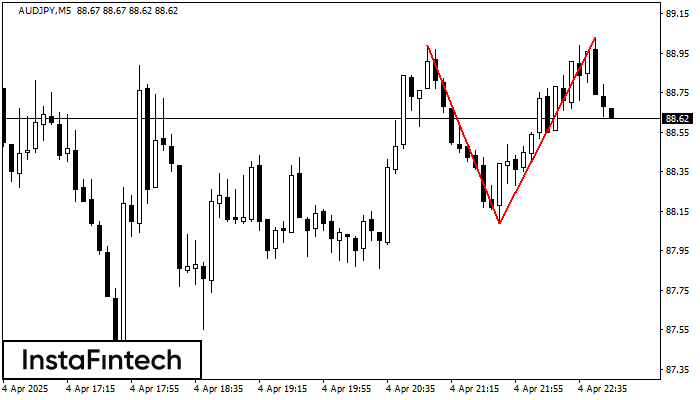
The Double Top pattern has been formed on AUDJPY M5. It signals that the trend has been changed from upwards to downwards. Probably, if the base of the pattern 88.09 is broken, the downward movement will continue.
The M5 and M15 time frames may have more false entry points.
আরও দেখুন
- All
- All
- Bearish Rectangle
- Bearish Symmetrical Triangle
- Bearish Symmetrical Triangle
- Bullish Rectangle
- Double Top
- Double Top
- Triple Bottom
- Triple Bottom
- Triple Top
- Triple Top
- All
- All
- Buy
- Sale
- All
- 1
- 2
- 3
- 4
- 5
Bearish Symmetrical Triangle
сформирован 11.04 в 09:13:08 (UTC+0)
сила сигнала 2 из 5
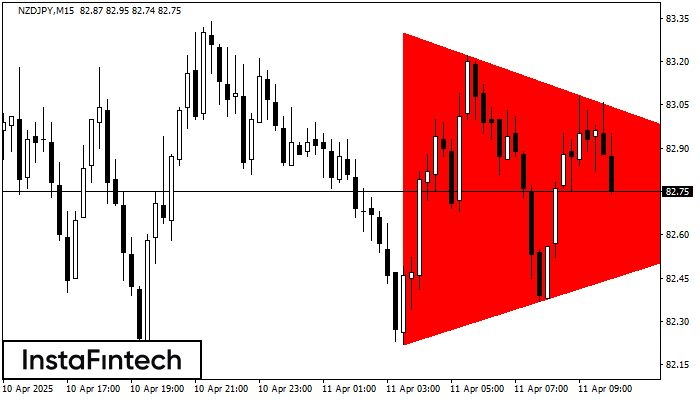
According to the chart of M15, NZDJPY formed the Bearish Symmetrical Triangle pattern. This pattern signals a further downward trend in case the lower border 82.22 is breached. Here
The M5 and M15 time frames may have more false entry points.
Открыть график инструмента в новом окне
Double Top
сформирован 11.04 в 08:59:57 (UTC+0)
сила сигнала 2 из 5
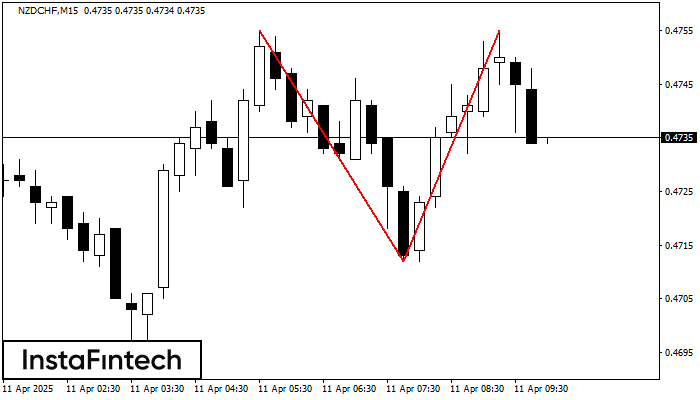
On the chart of NZDCHF M15 the Double Top reversal pattern has been formed. Characteristics: the upper boundary 0.4755; the lower boundary 0.4712; the width of the pattern 43 points
The M5 and M15 time frames may have more false entry points.
Открыть график инструмента в новом окне
Bearish Flag
сформирован 11.04 в 08:37:39 (UTC+0)
сила сигнала 1 из 5
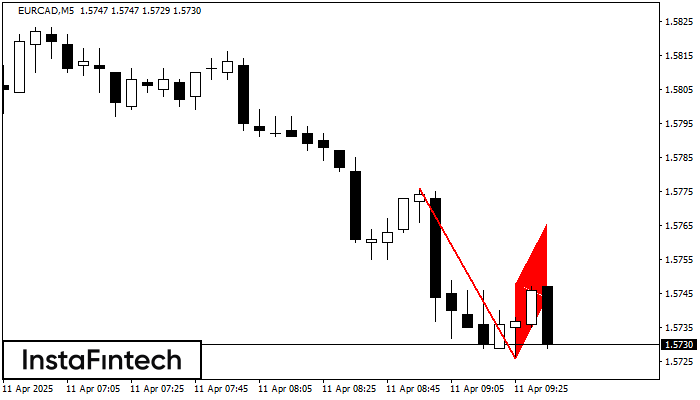
The Bearish Flag pattern has been formed on the chart EURCAD M5 which signals that the downward trend will continue. If the price breaks below the low at 1.5726, then
The M5 and M15 time frames may have more false entry points.
Открыть график инструмента в новом окне


