অ্যাকচুয়াল প্যাটার্নস

প্যাটার্ন হলো গ্রাফিক্যাল মডেল, যা মূল্য ওঠানামার ভিত্তিতে চার্টে তৈরি হয়। টেকনিক্যাল বিশ্লেষণের নীতি অনুযায়ী, ইতিহাসের (প্রাইস মুভমেন্ট) পুনরাবৃত্তি ঘটে। অর্থাৎ, পরিস্থিতি যদি একই রকম থাকে তাহলে প্রাইস মুভমেন্টও প্রায় একই রকম হয়। এর ফলে মূল্যের ওঠানামা কেমন হবে তা আগেই থেকেই অনুমান করা যায়।
ইন্সটাফরেক্স এর প্রাসঙ্গিক প্যাটার্নসমূহ সহজেই ব্যবহার করা যায়, যার মাধ্যমে মার্কেটের সর্বশেষ পরিস্থিতি জানা যায় এবং তার উপর ভিত্তি করে সিদ্ধান্ত নেওয়া যায়। আমাদের সেবাগুলো থেকে আপনি যেকোনো পেয়ার এবং টাইমফ্রেমের জন্য সর্বশেষ এবং সবচেয়ে প্রাসঙ্গিক প্যাটার্নগুলো খুঁজে পাবেন।
Bearish Symmetrical Triangle
was formed on 21.03 at 17:13:29 (UTC+0)
signal strength 1 of 5
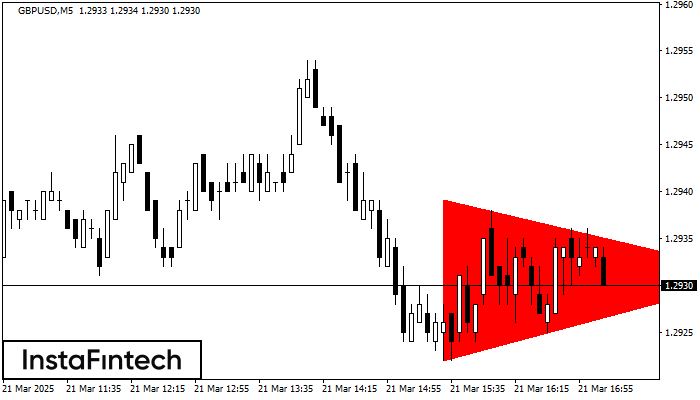
According to the chart of M5, GBPUSD formed the Bearish Symmetrical Triangle pattern. Description: The lower border is 1.2922/1.2931 and upper border is 1.2939/1.2931. The pattern width is measured on the chart at -17 pips. The formation of the Bearish Symmetrical Triangle pattern evidently signals a continuation of the downward trend. In other words, if the scenario comes true and GBPUSD breaches the lower border, the price could continue its move toward 1.2916.
The M5 and M15 time frames may have more false entry points.
আরও দেখুন
- All
- All
- Bearish Rectangle
- Bearish Symmetrical Triangle
- Bearish Symmetrical Triangle
- Bullish Rectangle
- Double Top
- Double Top
- Triple Bottom
- Triple Bottom
- Triple Top
- Triple Top
- All
- All
- Buy
- Sale
- All
- 1
- 2
- 3
- 4
- 5
Bullish Rectangle
was formed on 25.03 at 01:16:00 (UTC+0)
signal strength 2 of 5
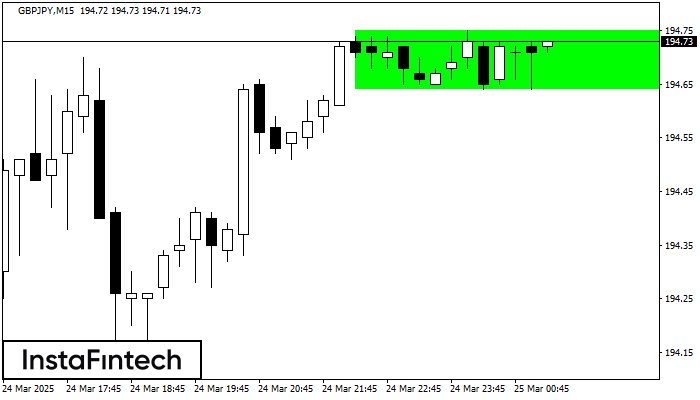
According to the chart of M15, GBPJPY formed the Bullish Rectangle. This type of a pattern indicates a trend continuation. It consists of two levels: resistance 194.75 and support 194.64
The M5 and M15 time frames may have more false entry points.
Open chart in a new window
Double Top
was formed on 25.03 at 01:00:30 (UTC+0)
signal strength 3 of 5
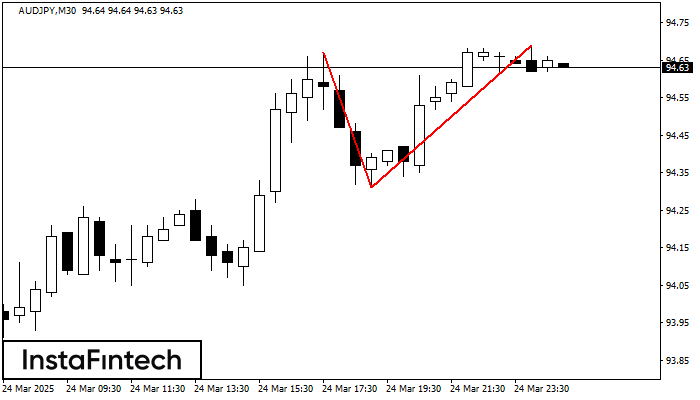
On the chart of AUDJPY M30 the Double Top reversal pattern has been formed. Characteristics: the upper boundary 94.69; the lower boundary 94.31; the width of the pattern 38 points
Open chart in a new window
Bullish Rectangle
was formed on 25.03 at 00:41:00 (UTC+0)
signal strength 1 of 5
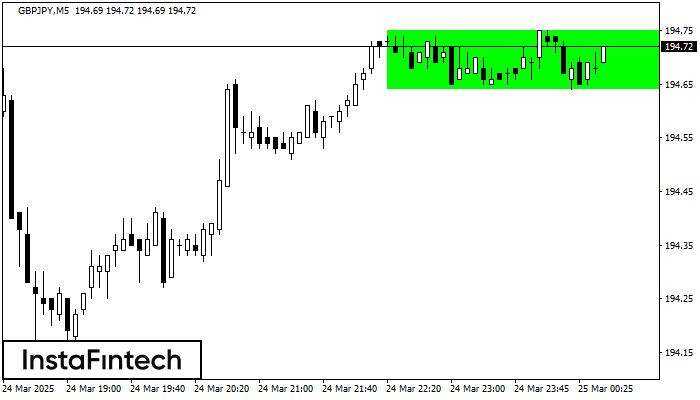
According to the chart of M5, GBPJPY formed the Bullish Rectangle. This type of a pattern indicates a trend continuation. It consists of two levels: resistance 194.75 and support 194.64
The M5 and M15 time frames may have more false entry points.
Open chart in a new window