

অ্যাকচুয়াল প্যাটার্নস

প্যাটার্ন হলো গ্রাফিক্যাল মডেল, যা মূল্য ওঠানামার ভিত্তিতে চার্টে তৈরি হয়। টেকনিক্যাল বিশ্লেষণের নীতি অনুযায়ী, ইতিহাসের (প্রাইস মুভমেন্ট) পুনরাবৃত্তি ঘটে। অর্থাৎ, পরিস্থিতি যদি একই রকম থাকে তাহলে প্রাইস মুভমেন্টও প্রায় একই রকম হয়। এর ফলে মূল্যের ওঠানামা কেমন হবে তা আগেই থেকেই অনুমান করা যায়।
ইন্সটাফরেক্স এর প্রাসঙ্গিক প্যাটার্নসমূহ সহজেই ব্যবহার করা যায়, যার মাধ্যমে মার্কেটের সর্বশেষ পরিস্থিতি জানা যায় এবং তার উপর ভিত্তি করে সিদ্ধান্ত নেওয়া যায়। আমাদের সেবাগুলো থেকে আপনি যেকোনো পেয়ার এবং টাইমফ্রেমের জন্য সর্বশেষ এবং সবচেয়ে প্রাসঙ্গিক প্যাটার্নগুলো খুঁজে পাবেন।
Bullish Rectangle
was formed on 21.03 at 00:40:12 (UTC+0)
signal strength 2 of 5
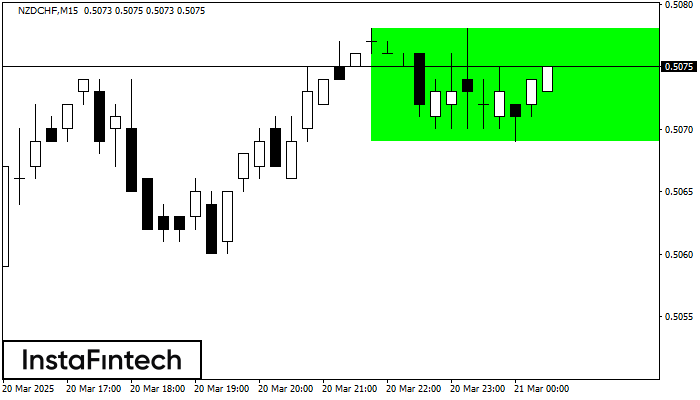
According to the chart of M15, NZDCHF formed the Bullish Rectangle. The pattern indicates a trend continuation. The upper border is 0.5078, the lower border is 0.5069. The signal means that a long position should be opened above the upper border 0.5078 of the Bullish Rectangle.
The M5 and M15 time frames may have more false entry points.
আরও দেখুন
- All
- All
- Bearish Rectangle
- Bearish Symmetrical Triangle
- Bearish Symmetrical Triangle
- Bullish Rectangle
- Double Top
- Double Top
- Triple Bottom
- Triple Bottom
- Triple Top
- Triple Top
- All
- All
- Buy
- Sale
- All
- 1
- 2
- 3
- 4
- 5
Triple Top
was formed on 25.03 at 00:30:26 (UTC+0)
signal strength 2 of 5
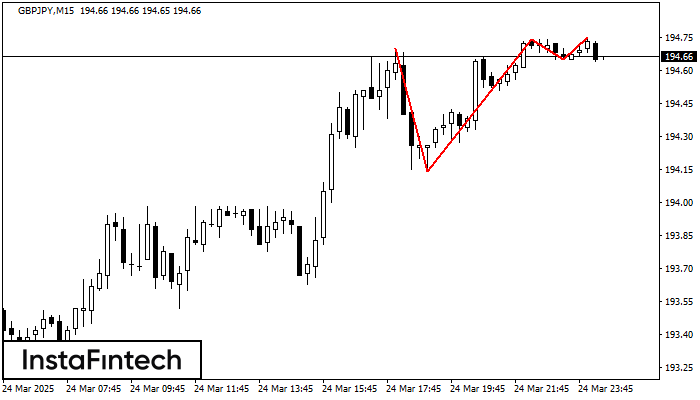
The Triple Top pattern has formed on the chart of the GBPJPY M15 trading instrument. It is a reversal pattern featuring the following characteristics: resistance level -5, support level -51
The M5 and M15 time frames may have more false entry points.
Open chart in a new window
Double Bottom
was formed on 25.03 at 00:00:26 (UTC+0)
signal strength 5 of 5
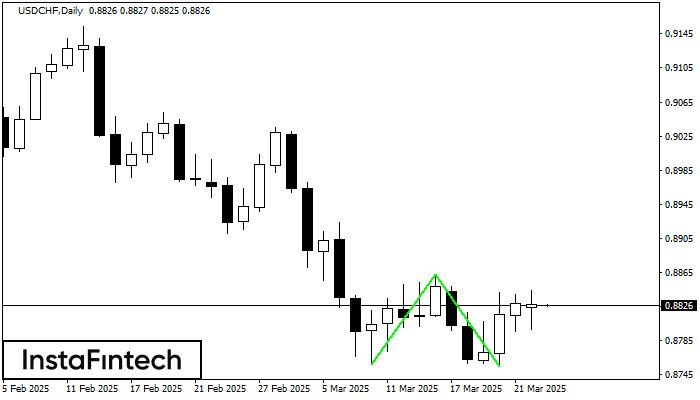
The Double Bottom pattern has been formed on USDCHF D1. Characteristics: the support level 0.8757; the resistance level 0.8863; the width of the pattern 106 points. If the resistance level
Open chart in a new window
Triple Top
was formed on 24.03 at 23:01:00 (UTC+0)
signal strength 1 of 5

The Triple Top pattern has formed on the chart of the EURJPY M5. Features of the pattern: borders have an ascending angle; the lower line of the pattern
The M5 and M15 time frames may have more false entry points.
Open chart in a new window


