

অ্যাকচুয়াল প্যাটার্নস

প্যাটার্ন হলো গ্রাফিক্যাল মডেল, যা মূল্য ওঠানামার ভিত্তিতে চার্টে তৈরি হয়। টেকনিক্যাল বিশ্লেষণের নীতি অনুযায়ী, ইতিহাসের (প্রাইস মুভমেন্ট) পুনরাবৃত্তি ঘটে। অর্থাৎ, পরিস্থিতি যদি একই রকম থাকে তাহলে প্রাইস মুভমেন্টও প্রায় একই রকম হয়। এর ফলে মূল্যের ওঠানামা কেমন হবে তা আগেই থেকেই অনুমান করা যায়।
ইন্সটাফরেক্স এর প্রাসঙ্গিক প্যাটার্নসমূহ সহজেই ব্যবহার করা যায়, যার মাধ্যমে মার্কেটের সর্বশেষ পরিস্থিতি জানা যায় এবং তার উপর ভিত্তি করে সিদ্ধান্ত নেওয়া যায়। আমাদের সেবাগুলো থেকে আপনি যেকোনো পেয়ার এবং টাইমফ্রেমের জন্য সর্বশেষ এবং সবচেয়ে প্রাসঙ্গিক প্যাটার্নগুলো খুঁজে পাবেন।
Double Top
was formed on 18.03 at 05:30:15 (UTC+0)
signal strength 3 of 5
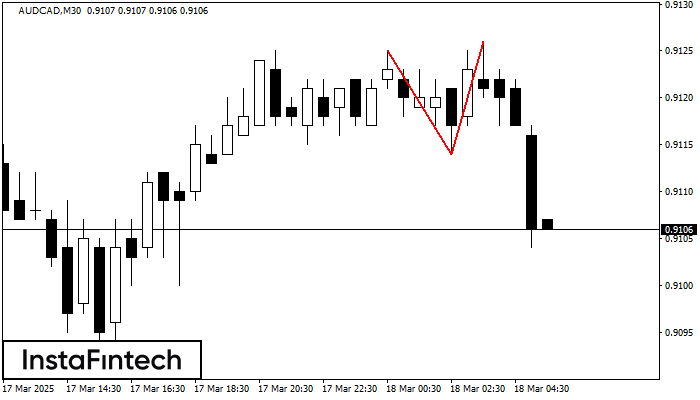
On the chart of AUDCAD M30 the Double Top reversal pattern has been formed. Characteristics: the upper boundary 0.9126; the lower boundary 0.9114; the width of the pattern 12 points. The signal: a break of the lower boundary will cause continuation of the downward trend targeting the 0.9084 level.
আরও দেখুন
- All
- All
- Bearish Rectangle
- Bearish Symmetrical Triangle
- Bearish Symmetrical Triangle
- Bullish Rectangle
- Double Top
- Double Top
- Triple Bottom
- Triple Bottom
- Triple Top
- Triple Top
- All
- All
- Buy
- Sale
- All
- 1
- 2
- 3
- 4
- 5
ট্রিপল বটম
was formed on 18.03 at 18:15:41 (UTC+0)
signal strength 1 of 5
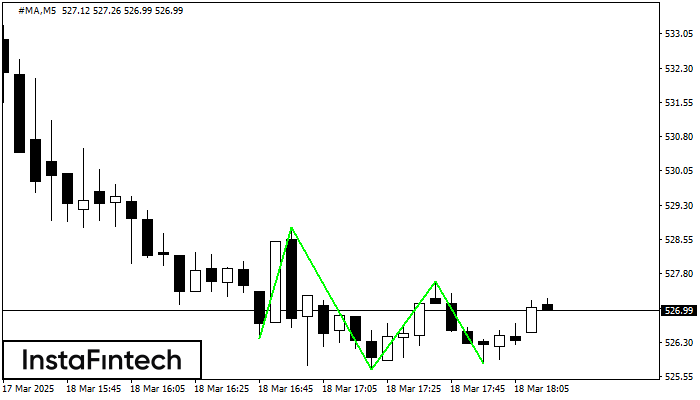
M5 চার্টে, #MA ট্রেডিং ইন্সট্রুমেন্টের ট্রিপল বটম প্যাটার্ন গঠিত হয়েছে। 528.82/527.64 ব্রেকডাউনের ক্ষেত্রে এই প্যাটার্ন নিম্নমুখী প্রবণতা থেকে ঊর্ধ্বমুখী প্রবণতায় পরিবর্তনের সংকেত দেয়৷
M5 এবং M15 টাইম ফ্রেমে আরও ভুল এন্ট্রি পয়েন্ট থাকতে পারে।
Open chart in a new window
ডাবল বটম
was formed on 18.03 at 17:14:56 (UTC+0)
signal strength 2 of 5
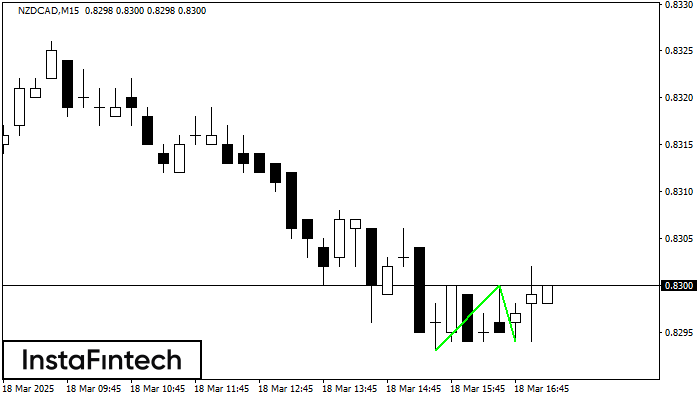
M15 চার্টে, NZDCAD-এর ডাবল বটম প্যাটার্নটি গঠিত হয়েছে। উপরের সীমানা হল 0.8300; নীচের সীমানা হল 0.8294। প্যাটার্নের প্রস্থ হল 7 পয়েন্ট। 0.8300-এর উপরের সীমানা ভেদ করার ক্ষেত্রে, প্রবণতা পরিবর্তনের পূর্বাভাস
M5 এবং M15 টাইম ফ্রেমে আরও ভুল এন্ট্রি পয়েন্ট থাকতে পারে।
Open chart in a new window
বিয়ারিশ রেক্ট্যাঙ্গেল
was formed on 18.03 at 17:00:22 (UTC+0)
signal strength 2 of 5
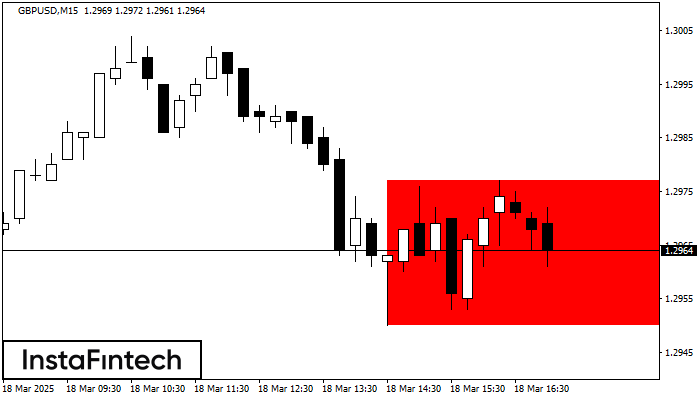
M15 চার্ট অনুসারে, GBPUSD বিয়ারিশ রেক্ট্যাঙ্গেল গঠন করেছে যা চলমান প্রবণতার ধারাবাহিকতার প্যাটার্ন। প্যাটার্নটি নিম্নলিখিত সীমানার মধ্যে রয়েছে: নীচের সীমানা 1.2950 – 1.2950 এবং উপরের সীমানা 1.2977 – 1.2977৷ নীচের
M5 এবং M15 টাইম ফ্রেমে আরও ভুল এন্ট্রি পয়েন্ট থাকতে পারে।
Open chart in a new window


