

অ্যাকচুয়াল প্যাটার্নস

প্যাটার্ন হলো গ্রাফিক্যাল মডেল, যা মূল্য ওঠানামার ভিত্তিতে চার্টে তৈরি হয়। টেকনিক্যাল বিশ্লেষণের নীতি অনুযায়ী, ইতিহাসের (প্রাইস মুভমেন্ট) পুনরাবৃত্তি ঘটে। অর্থাৎ, পরিস্থিতি যদি একই রকম থাকে তাহলে প্রাইস মুভমেন্টও প্রায় একই রকম হয়। এর ফলে মূল্যের ওঠানামা কেমন হবে তা আগেই থেকেই অনুমান করা যায়।
ইন্সটাফরেক্স এর প্রাসঙ্গিক প্যাটার্নসমূহ সহজেই ব্যবহার করা যায়, যার মাধ্যমে মার্কেটের সর্বশেষ পরিস্থিতি জানা যায় এবং তার উপর ভিত্তি করে সিদ্ধান্ত নেওয়া যায়। আমাদের সেবাগুলো থেকে আপনি যেকোনো পেয়ার এবং টাইমফ্রেমের জন্য সর্বশেষ এবং সবচেয়ে প্রাসঙ্গিক প্যাটার্নগুলো খুঁজে পাবেন।
Bearish pennant
was formed on 17.03 at 09:46:53 (UTC+0)
signal strength 1 of 5
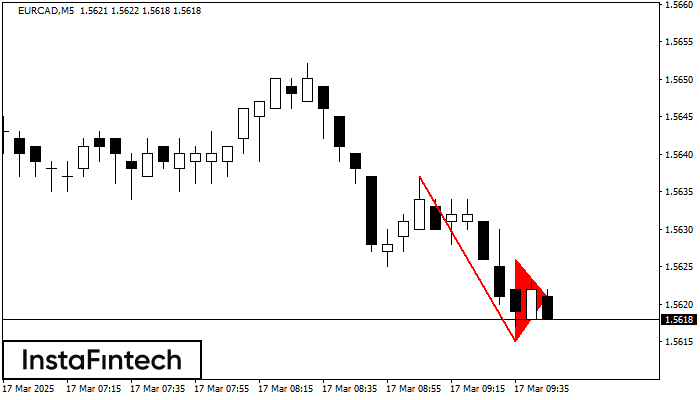
The Bearish pennant pattern has formed on the EURCAD M5 chart. This pattern type is characterized by a slight slowdown after which the price will move in the direction of the original trend. In case the price fixes below the pattern’s low of 1.5615, a trader will be able to successfully enter the sell position.
The M5 and M15 time frames may have more false entry points.
আরও দেখুন
- All
- All
- Bearish Rectangle
- Bearish Symmetrical Triangle
- Bearish Symmetrical Triangle
- Bullish Rectangle
- Double Top
- Double Top
- Triple Bottom
- Triple Bottom
- Triple Top
- Triple Top
- All
- All
- Buy
- Sale
- All
- 1
- 2
- 3
- 4
- 5
বিয়ারিশ সিমেট্রিক্যাল ট্রায়াঙ্গেল
was formed on 18.03 at 08:42:54 (UTC+0)
signal strength 1 of 5
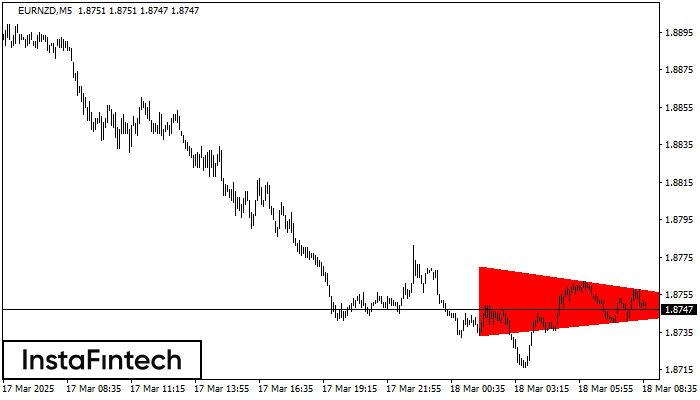
M5 চার্ট অনুযায়ী, EURNZD বিয়ারিশ সিমেট্রিক্যাল ট্রায়াঙ্গেল প্যাটার্ন গঠন করেছে। বর্ণনা: নীচের সীমানা হচ্ছে 1.8733/1.8748 এবং উপরের সীমানা হল 1.8770/1.8748৷ চার্টে প্যাটার্নের প্রস্থ -37 পিপস বলে পরিমাপ করা হয়েছে। বিয়ারিশ
M5 এবং M15 টাইম ফ্রেমে আরও ভুল এন্ট্রি পয়েন্ট থাকতে পারে।
Open chart in a new window
হেড অ্যান্ড শোল্ডার্স
was formed on 18.03 at 08:30:10 (UTC+0)
signal strength 3 of 5
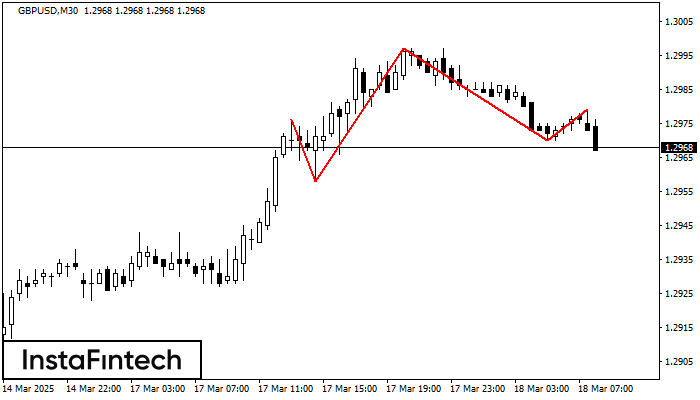
M30 চার্টে, GBPUSD-এর হেড অ্যান্ড শোল্ডার্স টেকনিক্যাল প্যাটার্ন গঠিত হয়েছে৷ ডান দিকের শোল্ডার গঠন হওয়ার পরে মূল্য 1.2958/1.2970-এর নেকলাইনকে ছাড়িয়ে যাবে বলে পরামর্শ দেওয়ার বেশ কিছু কারণ রয়েছে৷ সুতরাং, মূল্য
Open chart in a new window
ট্রিপল টপ
was formed on 18.03 at 08:01:01 (UTC+0)
signal strength 1 of 5
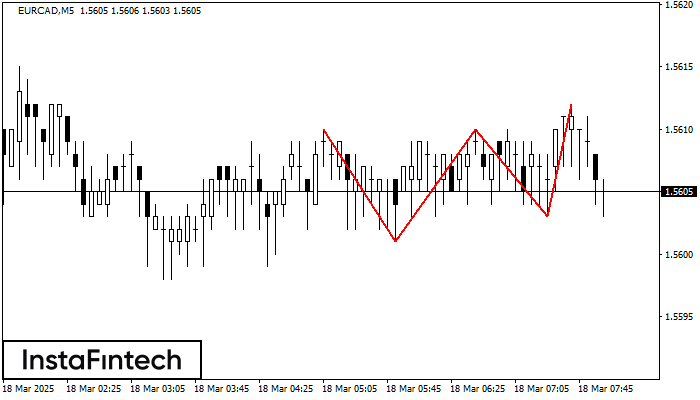
M5 চার্টে EURCAD-এর ট্রিপল টপ প্যাটার্নটি গঠিত হয়েছে। প্যাটার্নের বৈশিষ্ট্য: এই প্যাটার্নের সীমানাগুলোতে একটি ঊর্ধ্বমুখী অ্যাঙ্গেল বা কোণ আছে; প্যাটার্নের নীচের লাইনে 1.5601/1.5603-এর কোঅর্ডিনেট রয়েছে, উপরের সীমা 1.5610/1.5612; প্রস্থের প্রজেকশন
M5 এবং M15 টাইম ফ্রেমে আরও ভুল এন্ট্রি পয়েন্ট থাকতে পারে।
Open chart in a new window


