

অ্যাকচুয়াল প্যাটার্নস

প্যাটার্ন হলো গ্রাফিক্যাল মডেল, যা মূল্য ওঠানামার ভিত্তিতে চার্টে তৈরি হয়। টেকনিক্যাল বিশ্লেষণের নীতি অনুযায়ী, ইতিহাসের (প্রাইস মুভমেন্ট) পুনরাবৃত্তি ঘটে। অর্থাৎ, পরিস্থিতি যদি একই রকম থাকে তাহলে প্রাইস মুভমেন্টও প্রায় একই রকম হয়। এর ফলে মূল্যের ওঠানামা কেমন হবে তা আগেই থেকেই অনুমান করা যায়।
ইন্সটাফরেক্স এর প্রাসঙ্গিক প্যাটার্নসমূহ সহজেই ব্যবহার করা যায়, যার মাধ্যমে মার্কেটের সর্বশেষ পরিস্থিতি জানা যায় এবং তার উপর ভিত্তি করে সিদ্ধান্ত নেওয়া যায়। আমাদের সেবাগুলো থেকে আপনি যেকোনো পেয়ার এবং টাইমফ্রেমের জন্য সর্বশেষ এবং সবচেয়ে প্রাসঙ্গিক প্যাটার্নগুলো খুঁজে পাবেন।
Bearish Rectangle
was formed on 11.03 at 07:09:00 (UTC+0)
signal strength 3 of 5
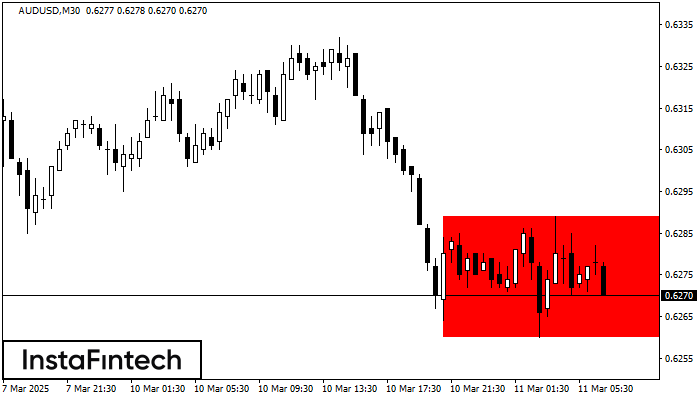
According to the chart of M30, AUDUSD formed the Bearish Rectangle. This type of a pattern indicates a trend continuation. It consists of two levels: resistance 0.6289 - 0.0000 and support 0.6260 – 0.6260. In case the resistance level 0.6260 - 0.6260 is broken, the instrument is likely to follow the bearish trend.
আরও দেখুন
- All
- All
- Bearish Rectangle
- Bearish Symmetrical Triangle
- Bearish Symmetrical Triangle
- Bullish Rectangle
- Double Top
- Double Top
- Triple Bottom
- Triple Bottom
- Triple Top
- Triple Top
- All
- All
- Buy
- Sale
- All
- 1
- 2
- 3
- 4
- 5
Bullish Symmetrical Triangle
was formed on 18.03 at 00:00:11 (UTC+0)
signal strength 2 of 5
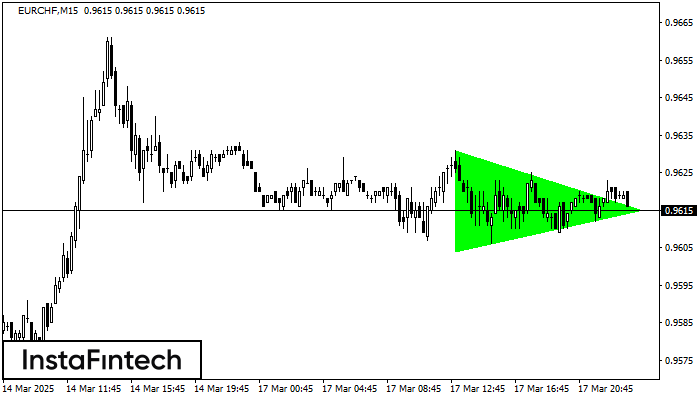
According to the chart of M15, EURCHF formed the Bullish Symmetrical Triangle pattern. Description: This is the pattern of a trend continuation. 0.9631 and 0.9604 are the coordinates
The M5 and M15 time frames may have more false entry points.
Open chart in a new window
Bearish Symmetrical Triangle
was formed on 17.03 at 23:55:40 (UTC+0)
signal strength 1 of 5
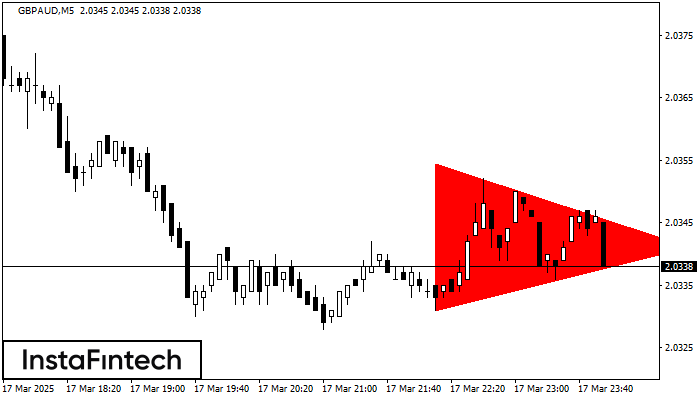
According to the chart of M5, GBPAUD formed the Bearish Symmetrical Triangle pattern. Description: The lower border is 2.0331/2.0341 and upper border is 2.0355/2.0341. The pattern width is measured
The M5 and M15 time frames may have more false entry points.
Open chart in a new window
Triple Top
was formed on 17.03 at 23:31:08 (UTC+0)
signal strength 2 of 5
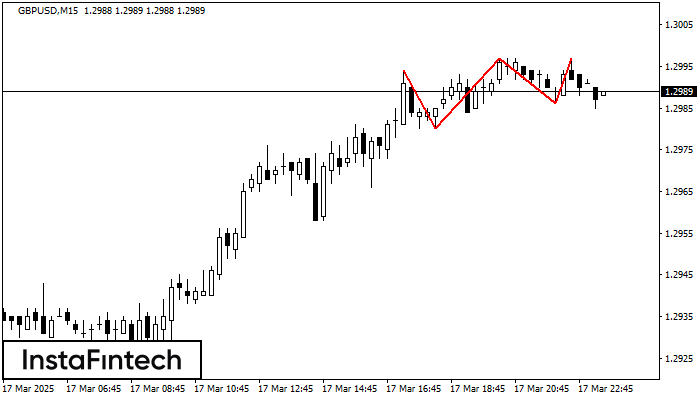
The Triple Top pattern has formed on the chart of the GBPUSD M15. Features of the pattern: borders have an ascending angle; the lower line of the pattern
The M5 and M15 time frames may have more false entry points.
Open chart in a new window


