

النماذج الفعلية

النماذج هي نماذج رسومية تتشكل في الرسم البياني حسب السعر. وفقا لأحد المسلمات التحليلية الفنية، فإن التاريخ (حركة السعر) يكرر نفسه. ويعني ذلك أن حركات الأسعار غالباً ما تكون متشابهة في نفس الأوضاع مما يجعل من الممكن التنبؤ بزيادة تطوير الوضع الذي يتسم باحتمال كبير.
النماذج ذات الصلة المقدمة من قبل إنستافوركس هي خدمة سهلة الاستخدام تسمح لك بمعرفة التغييرات الأخيرة في السوق والرد على الأدلة من السوق في الوقت المناسب. في خدمتنا، ستجد دائمًا النماذج الأكثر حداثة وملاءمة في أي زوج وأي إطار زمني.
Double Bottom
was formed on 25.03 at 12:00:11 (UTC+0)
signal strength 4 of 5
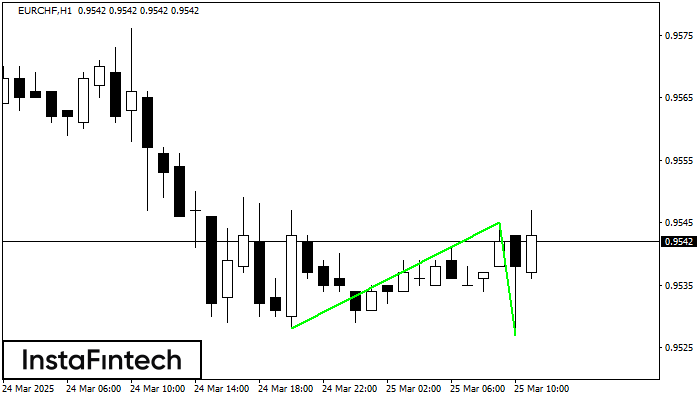
The Double Bottom pattern has been formed on EURCHF H1; the upper boundary is 0.9545; the lower boundary is 0.9527. The width of the pattern is 17 points. In case of a break of the upper boundary 0.9545, a change in the trend can be predicted where the width of the pattern will coincide with the distance to a possible take profit level.
- All
- All
- Bearish Rectangle
- Bearish Symmetrical Triangle
- Bearish Symmetrical Triangle
- Bullish Rectangle
- Double Top
- Double Top
- Triple Bottom
- Triple Bottom
- Triple Top
- Triple Top
- All
- All
- Buy
- Sale
- All
- 1
- 2
- 3
- 4
- 5
बियरिश सिमेट्रिकल त्रिभुज
was formed on 28.03 at 19:23:04 (UTC+0)
signal strength 4 of 5
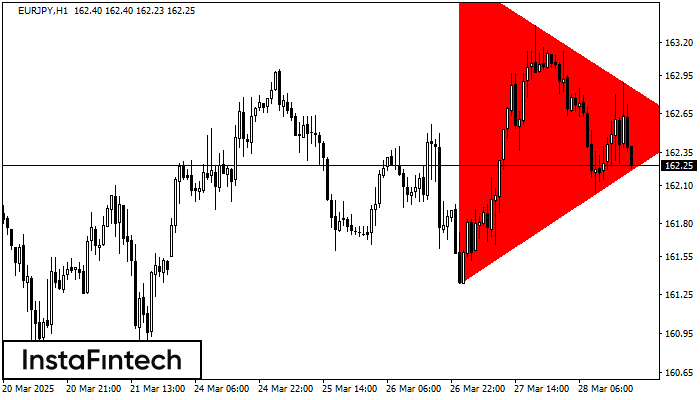
H1 के चार्ट के अनुसार, EURJPY से बियरिश सिमेट्रिकल त्रिभुज पैटर्न बना। निचली सीमा 161.34 भंग होने की स्थिति में यह पैटर्न और नीचे के ट्रेंड की ओर संकेत करता
Open chart in a new window
ट्रिपल बॉटम
was formed on 28.03 at 19:20:10 (UTC+0)
signal strength 1 of 5
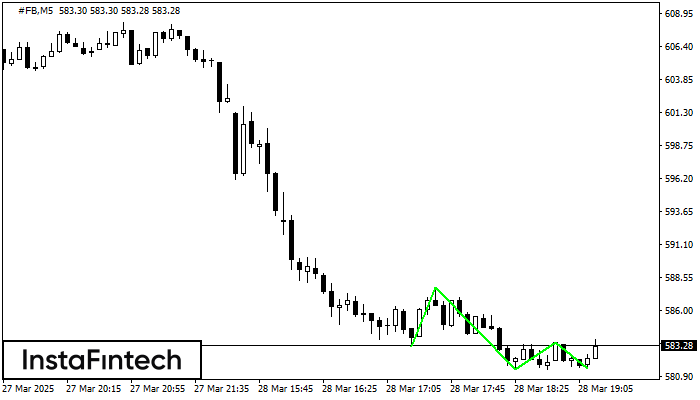
ट्रिपल बॉटम पैटर्न #FB M5 के चार्ट पर बना है। पैटर्न की विशेषताएं: पैटर्न की निचली रेखा 587.80 पर है जिसकी ऊपरी सीमा 587.80/583.54 है, प्रक्षेपण की चौड़ाई 459 पॉइंट्स
M5 और M15 समय सीमा में अधिक फाल्स एंट्री पॉइंट्स हो सकते हैं।
Open chart in a new window
डबल बॉटम
was formed on 28.03 at 18:15:28 (UTC+0)
signal strength 1 of 5
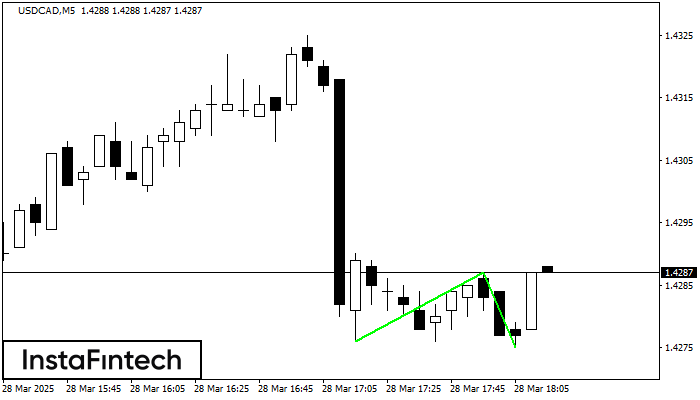
डबल बॉटम पैटर्न USDCAD M5 पर बना है। यह फॉर्मेशन नीचे से ऊपर की ओर प्रवृत्ति के उलट होने का संकेत देता है। संकेत यह है कि पैटर्न 1.4287 की
M5 और M15 समय सीमा में अधिक फाल्स एंट्री पॉइंट्स हो सकते हैं।
Open chart in a new window


