

النماذج الفعلية

النماذج هي نماذج رسومية تتشكل في الرسم البياني حسب السعر. وفقا لأحد المسلمات التحليلية الفنية، فإن التاريخ (حركة السعر) يكرر نفسه. ويعني ذلك أن حركات الأسعار غالباً ما تكون متشابهة في نفس الأوضاع مما يجعل من الممكن التنبؤ بزيادة تطوير الوضع الذي يتسم باحتمال كبير.
النماذج ذات الصلة المقدمة من قبل إنستافوركس هي خدمة سهلة الاستخدام تسمح لك بمعرفة التغييرات الأخيرة في السوق والرد على الأدلة من السوق في الوقت المناسب. في خدمتنا، ستجد دائمًا النماذج الأكثر حداثة وملاءمة في أي زوج وأي إطار زمني.
Bearish Symmetrical Triangle
was formed on 20.03 at 15:31:02 (UTC+0)
signal strength 4 of 5
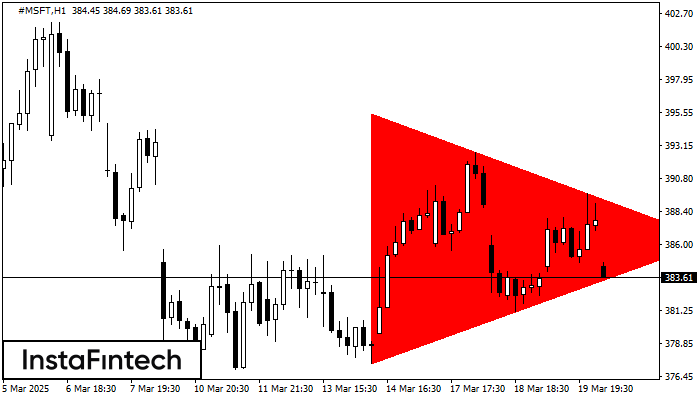
According to the chart of H1, #MSFT formed the Bearish Symmetrical Triangle pattern. Description: The lower border is 377.44/386.30 and upper border is 395.49/386.30. The pattern width is measured on the chart at -1805 pips. The formation of the Bearish Symmetrical Triangle pattern evidently signals a continuation of the downward trend. In other words, if the scenario comes true and #MSFT breaches the lower border, the price could continue its move toward 385.90.
- All
- All
- Bearish Rectangle
- Bearish Symmetrical Triangle
- Bearish Symmetrical Triangle
- Bullish Rectangle
- Double Top
- Double Top
- Triple Bottom
- Triple Bottom
- Triple Top
- Triple Top
- All
- All
- Buy
- Sale
- All
- 1
- 2
- 3
- 4
- 5
Bullish Flag
was formed on 21.03 at 19:22:58 (UTC+0)
signal strength 1 of 5
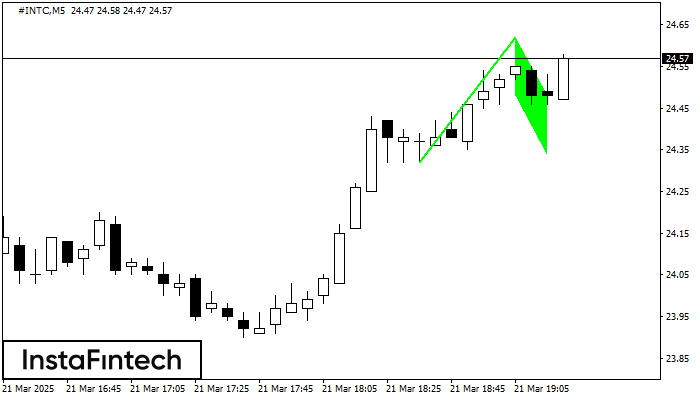
The Bullish Flag pattern has been formed on the chart #INTC M5 which signals that the upward trend will continue. Signals: а break of the peak at 24.62 may push
The M5 and M15 time frames may have more false entry points.
Open chart in a new window
Double Top
was formed on 21.03 at 19:20:13 (UTC+0)
signal strength 1 of 5
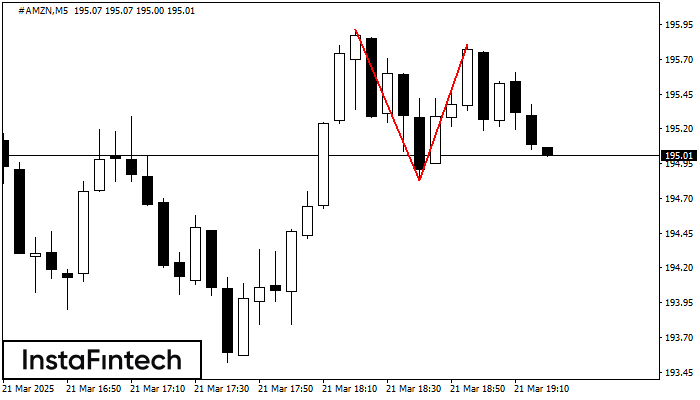
The Double Top reversal pattern has been formed on #AMZN M5. Characteristics: the upper boundary 195.92; the lower boundary 194.83; the width of the pattern is 98 points. Sell trades
The M5 and M15 time frames may have more false entry points.
Open chart in a new window
Triple Top
was formed on 21.03 at 19:15:29 (UTC+0)
signal strength 1 of 5
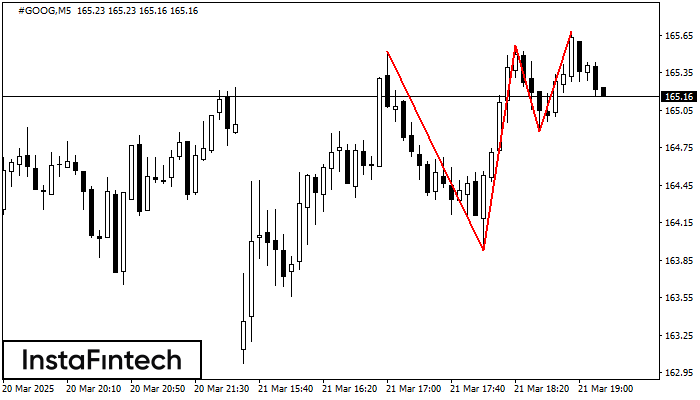
The Triple Top pattern has formed on the chart of the #GOOG M5 trading instrument. It is a reversal pattern featuring the following characteristics: resistance level -16, support level -95
The M5 and M15 time frames may have more false entry points.
Open chart in a new window


