

النماذج الفعلية

النماذج هي نماذج رسومية تتشكل في الرسم البياني حسب السعر. وفقا لأحد المسلمات التحليلية الفنية، فإن التاريخ (حركة السعر) يكرر نفسه. ويعني ذلك أن حركات الأسعار غالباً ما تكون متشابهة في نفس الأوضاع مما يجعل من الممكن التنبؤ بزيادة تطوير الوضع الذي يتسم باحتمال كبير.
النماذج ذات الصلة المقدمة من قبل إنستافوركس هي خدمة سهلة الاستخدام تسمح لك بمعرفة التغييرات الأخيرة في السوق والرد على الأدلة من السوق في الوقت المناسب. في خدمتنا، ستجد دائمًا النماذج الأكثر حداثة وملاءمة في أي زوج وأي إطار زمني.
Double Top
was formed on 16.03 at 06:30:03 (UTC+0)
signal strength 1 of 5
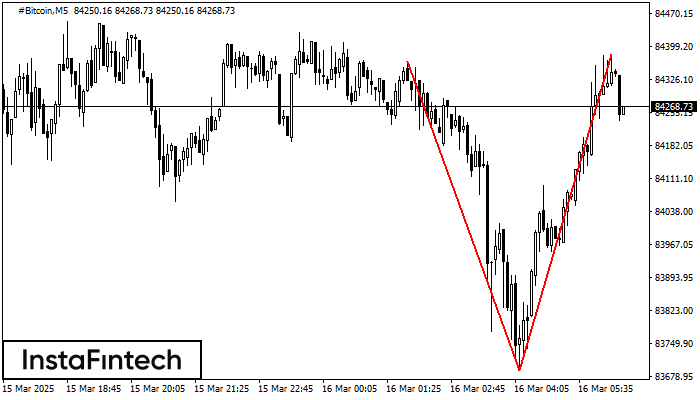
On the chart of #Bitcoin M5 the Double Top reversal pattern has been formed. Characteristics: the upper boundary 84382.33; the lower boundary 83691.55; the width of the pattern 69078 points. The signal: a break of the lower boundary will cause continuation of the downward trend targeting the 83691.40 level.
The M5 and M15 time frames may have more false entry points.
انظر أيضا
- All
- All
- Bearish Rectangle
- Bearish Symmetrical Triangle
- Bearish Symmetrical Triangle
- Bullish Rectangle
- Double Top
- Double Top
- Triple Bottom
- Triple Bottom
- Triple Top
- Triple Top
- All
- All
- Buy
- Sale
- All
- 1
- 2
- 3
- 4
- 5
Bearish pennant
was formed on 17.03 at 09:46:53 (UTC+0)
signal strength 1 of 5
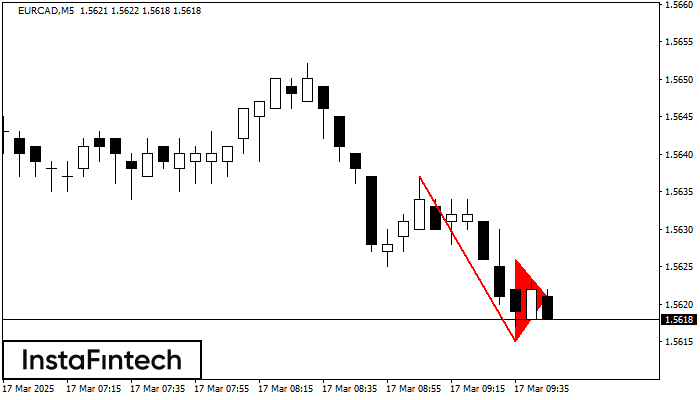
The Bearish pennant pattern has formed on the EURCAD M5 chart. This pattern type is characterized by a slight slowdown after which the price will move in the direction
The M5 and M15 time frames may have more false entry points.
Open chart in a new window
Bullish Symmetrical Triangle
was formed on 17.03 at 09:06:47 (UTC+0)
signal strength 4 of 5
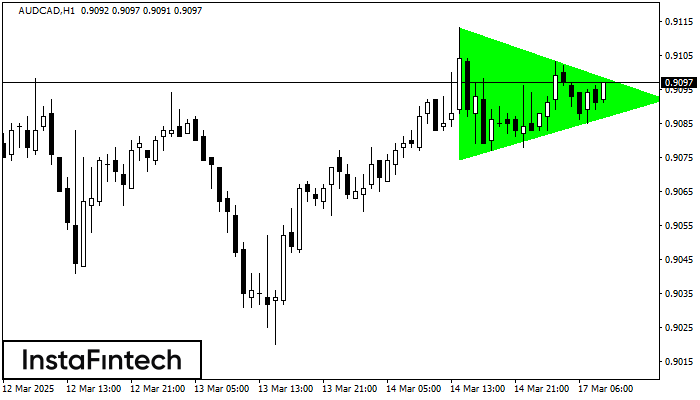
According to the chart of H1, AUDCAD formed the Bullish Symmetrical Triangle pattern. The lower border of the pattern touches the coordinates 0.9074/0.9092 whereas the upper border goes across 0.9113/0.9092
Open chart in a new window
Double Top
was formed on 17.03 at 08:45:50 (UTC+0)
signal strength 1 of 5
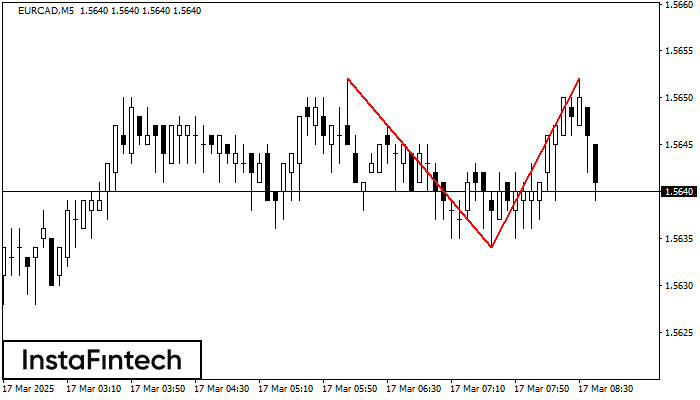
The Double Top pattern has been formed on EURCAD M5. It signals that the trend has been changed from upwards to downwards. Probably, if the base of the pattern 1.5634
The M5 and M15 time frames may have more false entry points.
Open chart in a new window


